It’s been a while, although I’ve been taking notes on stuff I wanted to write, I got wrapped up in some work in the labs, including some stuff on polysome profiling.
Polysome profiling is a great tool for taking a peek at the process of translation – the messenger RNA being read by ribosomes and “translated” into the protein. It’s a fairly simple process too, take some (well preserved – liquid nitrogen) tissue and grind it up in a buffer containing cycloheximide to extract the mRNA and keep the ribosomes frozen in place along the message. You can then analyse this huge pool of mRNA-protein/rRNA in a number of ways, there are some great sequencing techniques that have been used to figure out things like ribosome pause sites – thought to be necessary for the proper folding of proteins. However, the method I’ve been using for the last few years (and tinkering with the last few weeks) is one based on separating out the messages based on how many ribosomes are bound to them, principally the more ribosomes that are bound, the more heavily translating a message is (although I can’t help but wonder if some very fast translating messages could have fewer ribosomes bound to them at any one moment) so you can get a UV trace as a result, and use that data to compare mutants, treatments etc. and see how they affect translation.
Polysome profiling in this way offers an insight into the status of translation of an organism (or cell line, etc.) at the time of freezing by analysing the abundance of proteins according to their resting position after ultracentrifugation in a sucrose gradient. A polysome profile can also act as a preparatory step, so I could then take certain collected fractions and compare them in different ways (i.e. how do highly translating messages look compared to messages found with just one or two ribosomes bound?). Throw the trace and some sequencing together and you have a powerful (although involved) tool for analysing gene expression.
Anyway! The point of this little note is to help anyone along that is struggling connecting the UA-6 Absorbance detector by teledyne ISCO to a computer. Doing so lets you take in all the data that is output from the UV absorbance as well as get finer detail in the peaks… and having a digital copy right off the bat means I could have avoiding hours scanning and formatting traces for comparison and done more science! We tried for a while through the “correct” routes – involving ridiculous, expensive cables and terribly written software that only supported windows XP, after some tinkering I managed to get it all communicating except the fraction collector would then try to take instructions from the terrible software rather than its perfectly fine pre-programmed instructions – ruining a trial run and sending me back to the drawing board.
You only need a voltage recorder and some banana plugs
It’s really that easy. Anything that can record a voltage between 0 and 1v and can take that reading about every second or so will be enough to get a digital trace. Something like this works just fine!
There’s a silly cable that plugs into this mess of banana plug sockets on the back of the fraction collector:
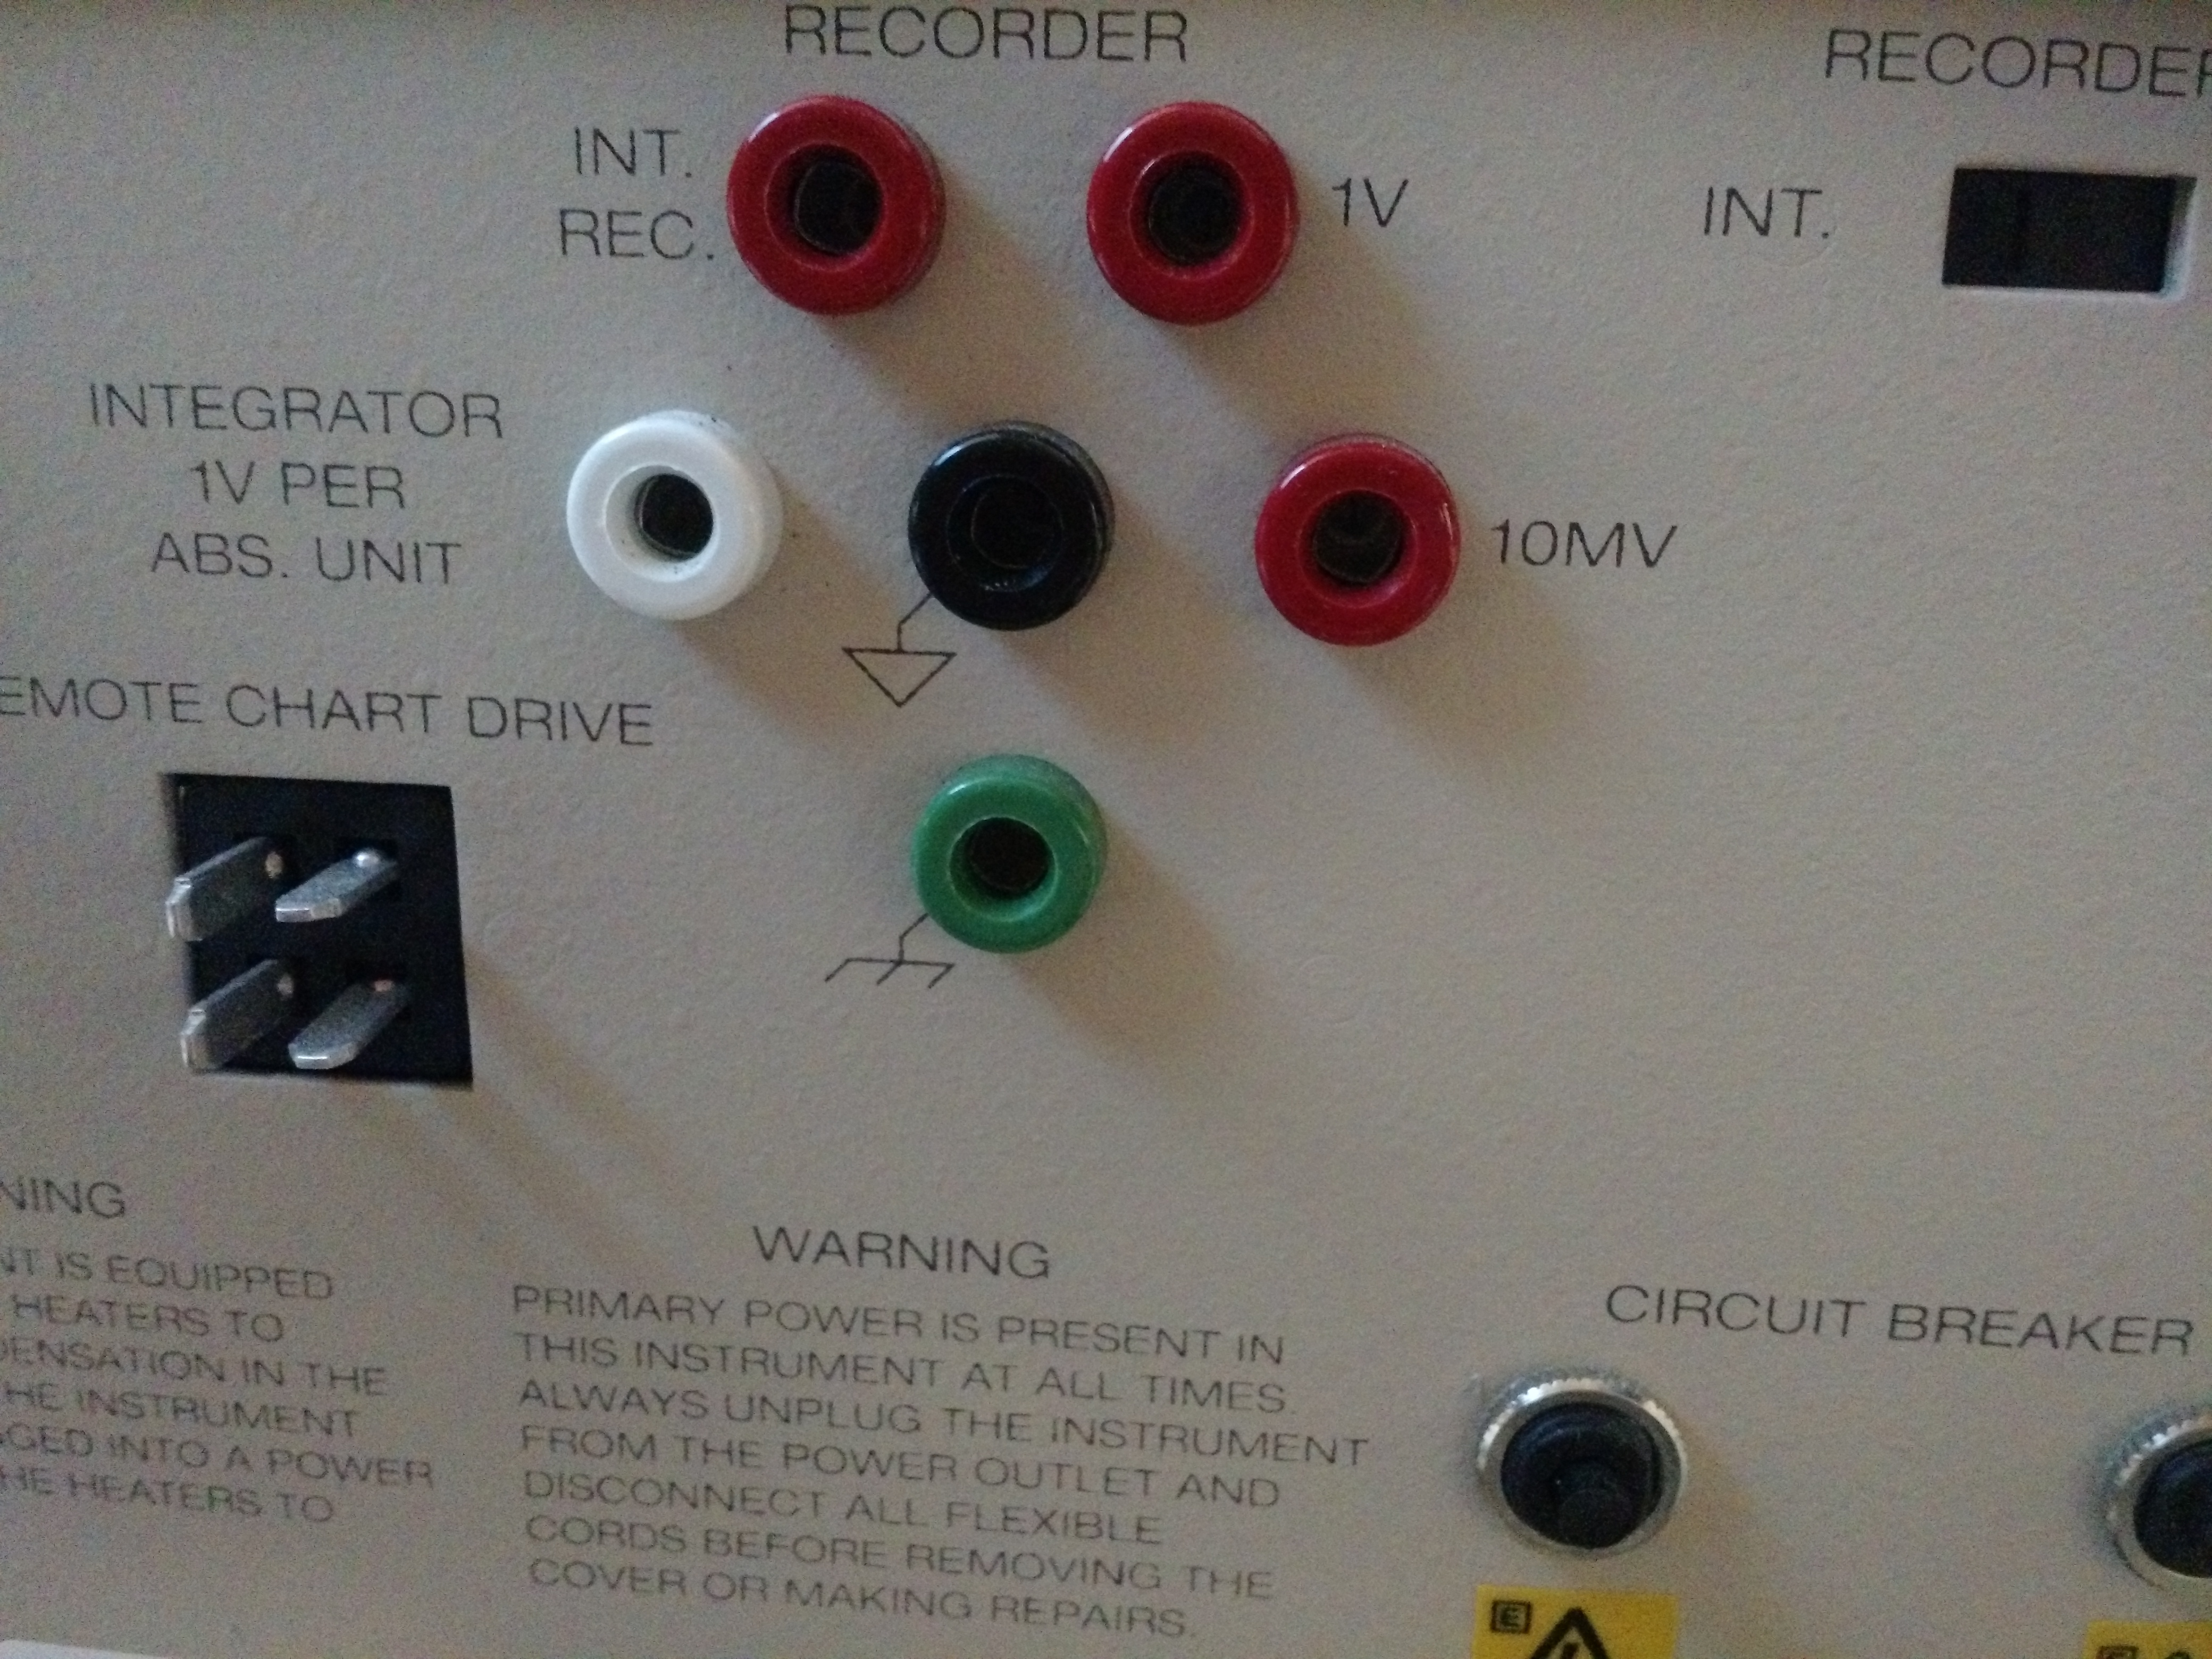
This cable carries an analogue voltage through to the fraction collector which is then supposed to send the data on to a computer to generate a nice digitised trace, in my experience that didn’t happen.
So instead, Take voltage readings straight from those banana sockets, at the 1V point and the ground (black) point:
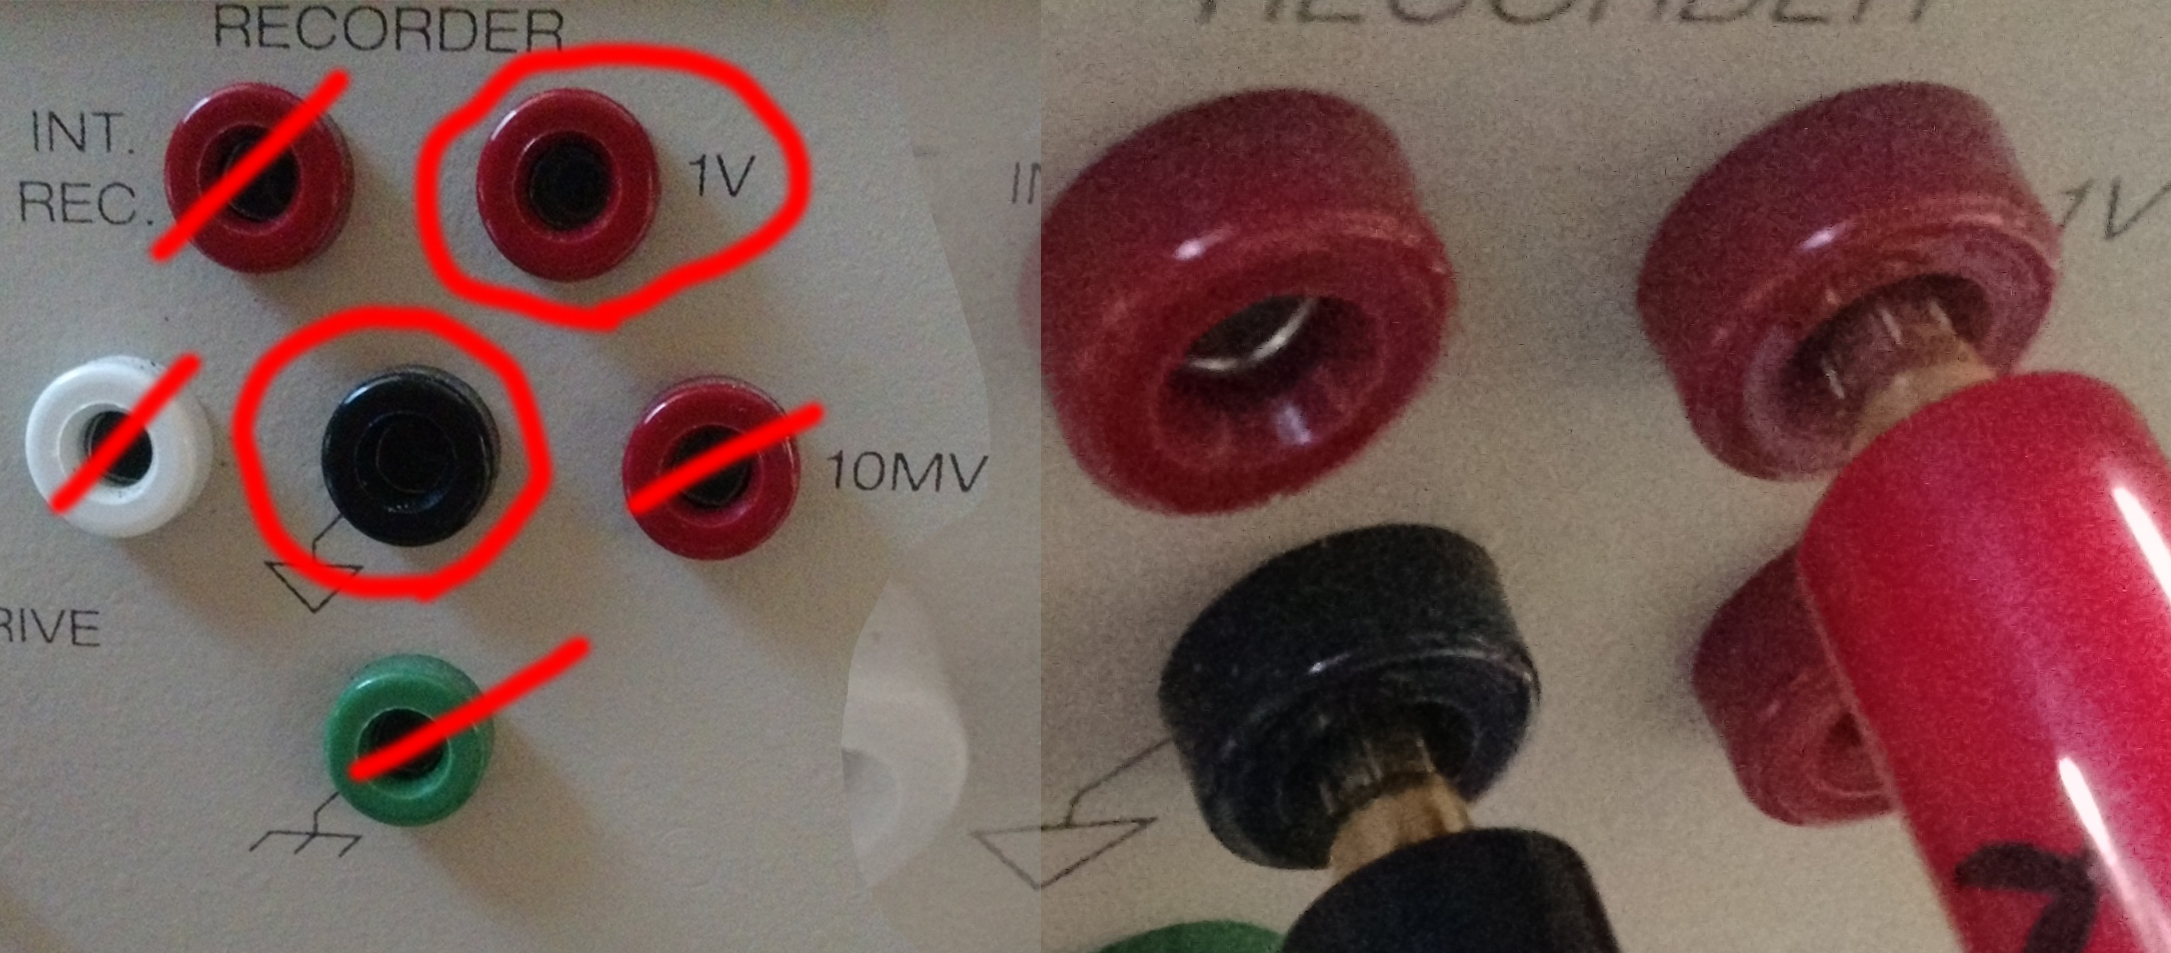
Although you won’t be recording absorbency values, the voltage reading will give the same trace as if the fraction collector were interpreting the voltages (I’ll try to get a decent pair of pictures up for comparison soon!). It’s a system that I’m hoping to improve upon, and using the raw voltage values in excel you may be able to calculate some neat things about the differences in translation, but that’ll be for another time I think!
Just an additional note: I did consider doing this with a raspberry pi I had lying around, but the GPIO on those things, whilst incredibly useful, is digital (i.e. 1 vs 0, rather than analogue which is a continuous range between two values), making this a much more involved process. I think you’d need to rig up a simple circuit that charges a capacitor with the voltage supplied by the detector, and then have that discharge into one of the GPIO pins on the Pi – a discharge could be “1” and not discharging would be “0” to the Pi. Then any programming would involve measuring the time between discharges or “1’s” from the capacitor. Higher voltage = higher UV absorbence = quicker discharge rate of the capacitor. You’d end up with an inverse of the true graph, but it wouldn’t take much tinkering in excel to fix that.
The advantage of a raspberry pi though is that you can then have it email you the data automatically, text you to say everything is done, reverse the pump or get your kettle boiling at home!
